Make great data visualizations
Do you want to learn to make charts that tell a story, not just show data? Let me help you! By the end of this workshop, you will understand how to use text, shapes, colours and emphasis to turn tables into crisp and crystal clear information bites.
The only things you need is some time, a bit of money, a piece of paper and a handful of colored pencils! 🖍️
What You’ll Learn
✨ What are the key principles of effective data visualization
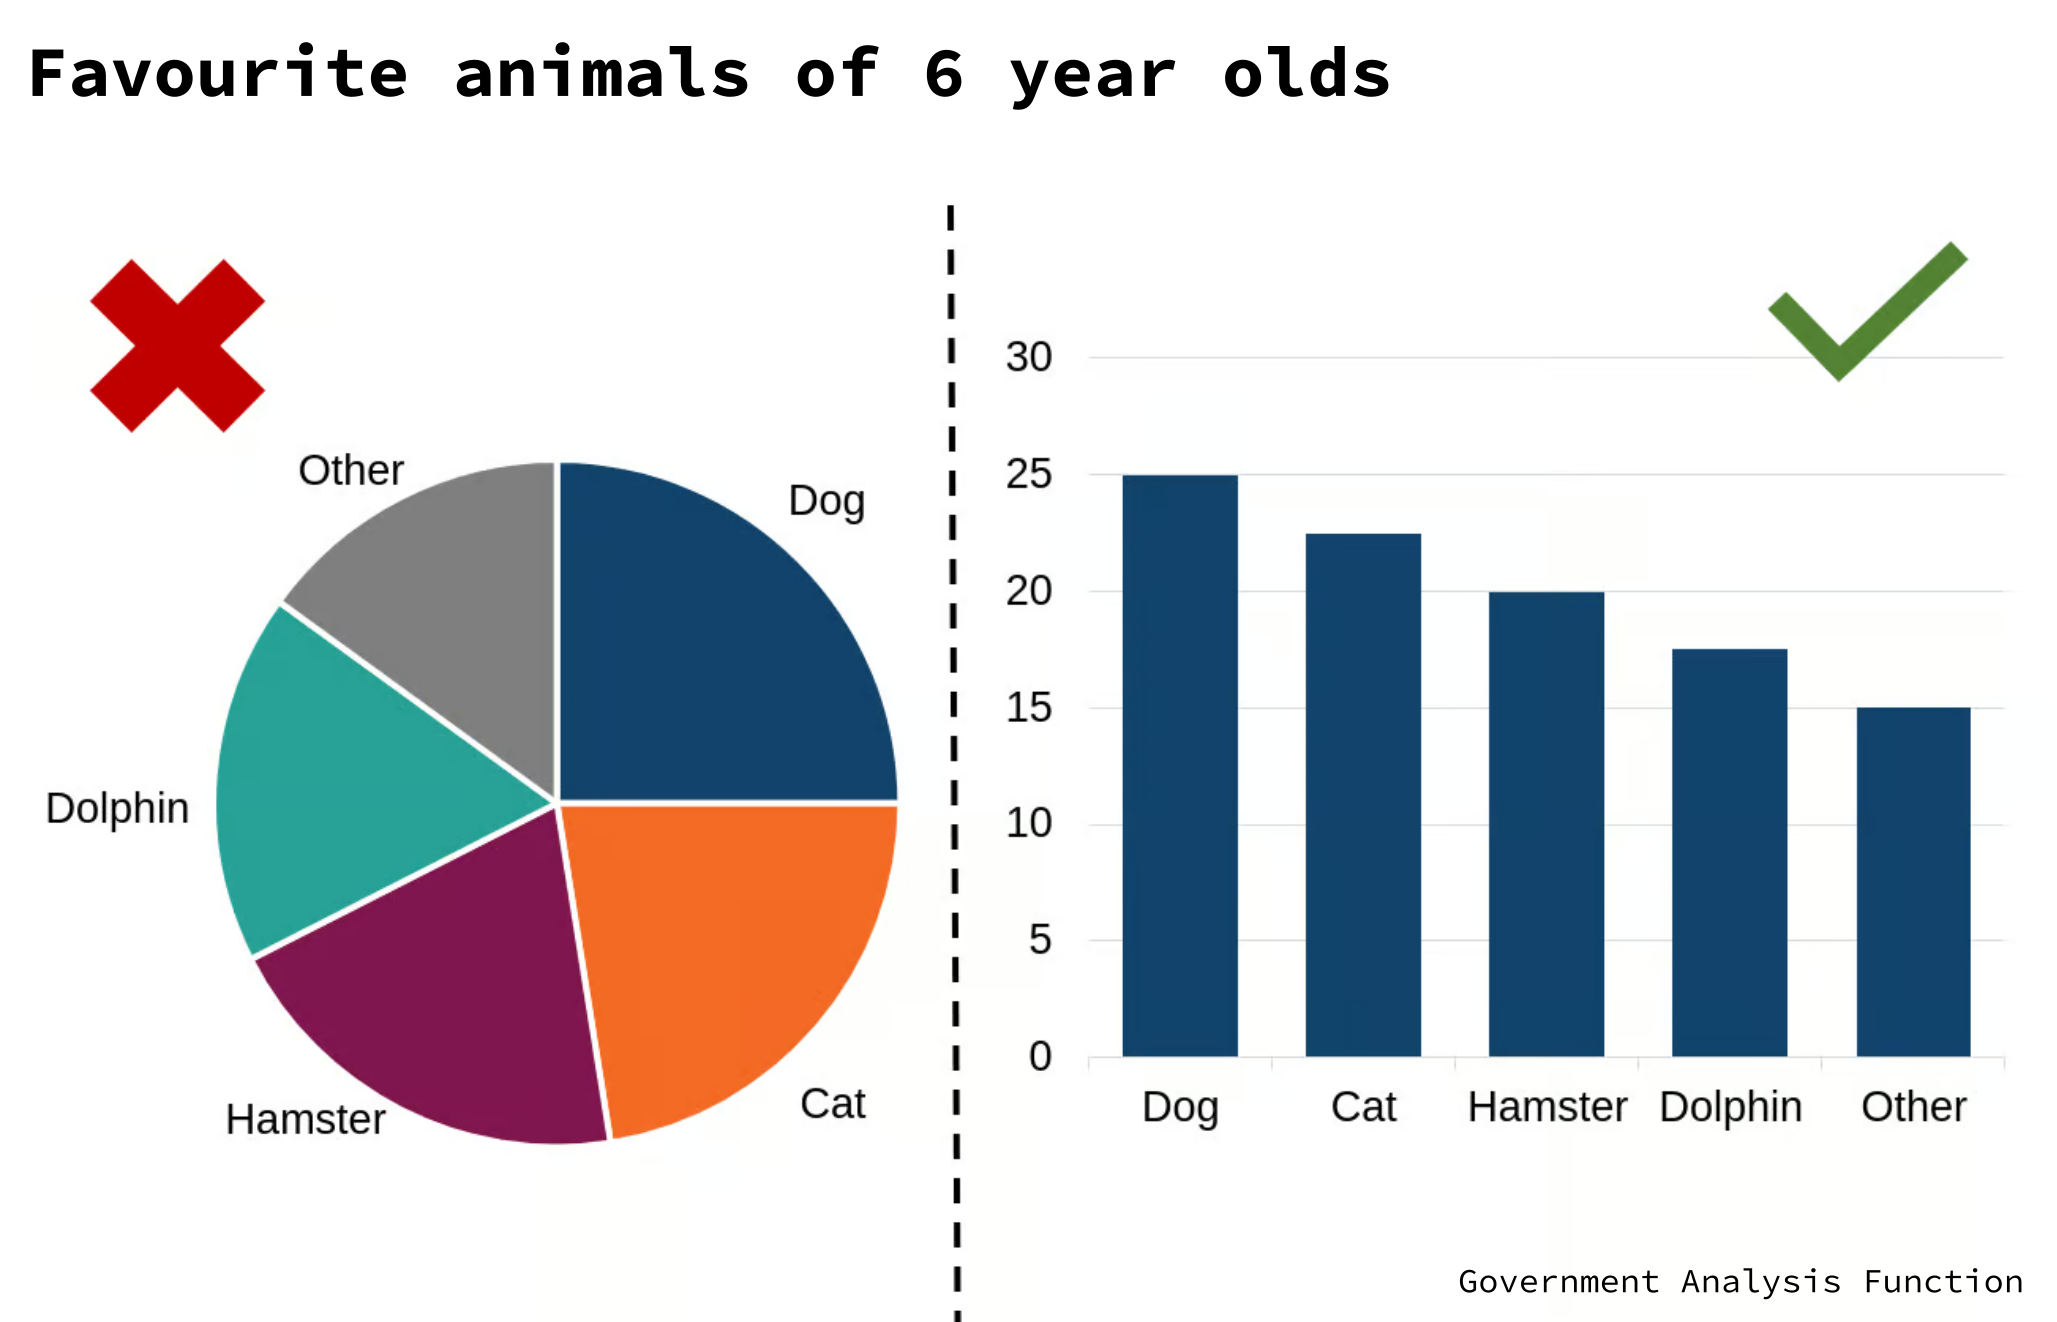
📊 Which is the right chart to for your data
👁️ How to use colors, text and annotations for clarity and focus
This workshop is for
👩🏻💻 Reporters or data analysts struggling to turn their Excel findings into data visualisations
👩🏼💻 Editors that would like to learn how to assess whether a chart effectively conveys a message
👩🏽💻 Designers skilled at aesthetics but challenged when it comes to creating a clear narrative with data
No prior knowledge required. Familiarity with Excel is helpful but not essential.
Format
1.5-2 hour Online Workshop. Includes practical, hands-on exercise and a Q&A session.
Upcoming dates
🗓️ 10 April at 16:30. Book your ticket here. (The participation is limited)