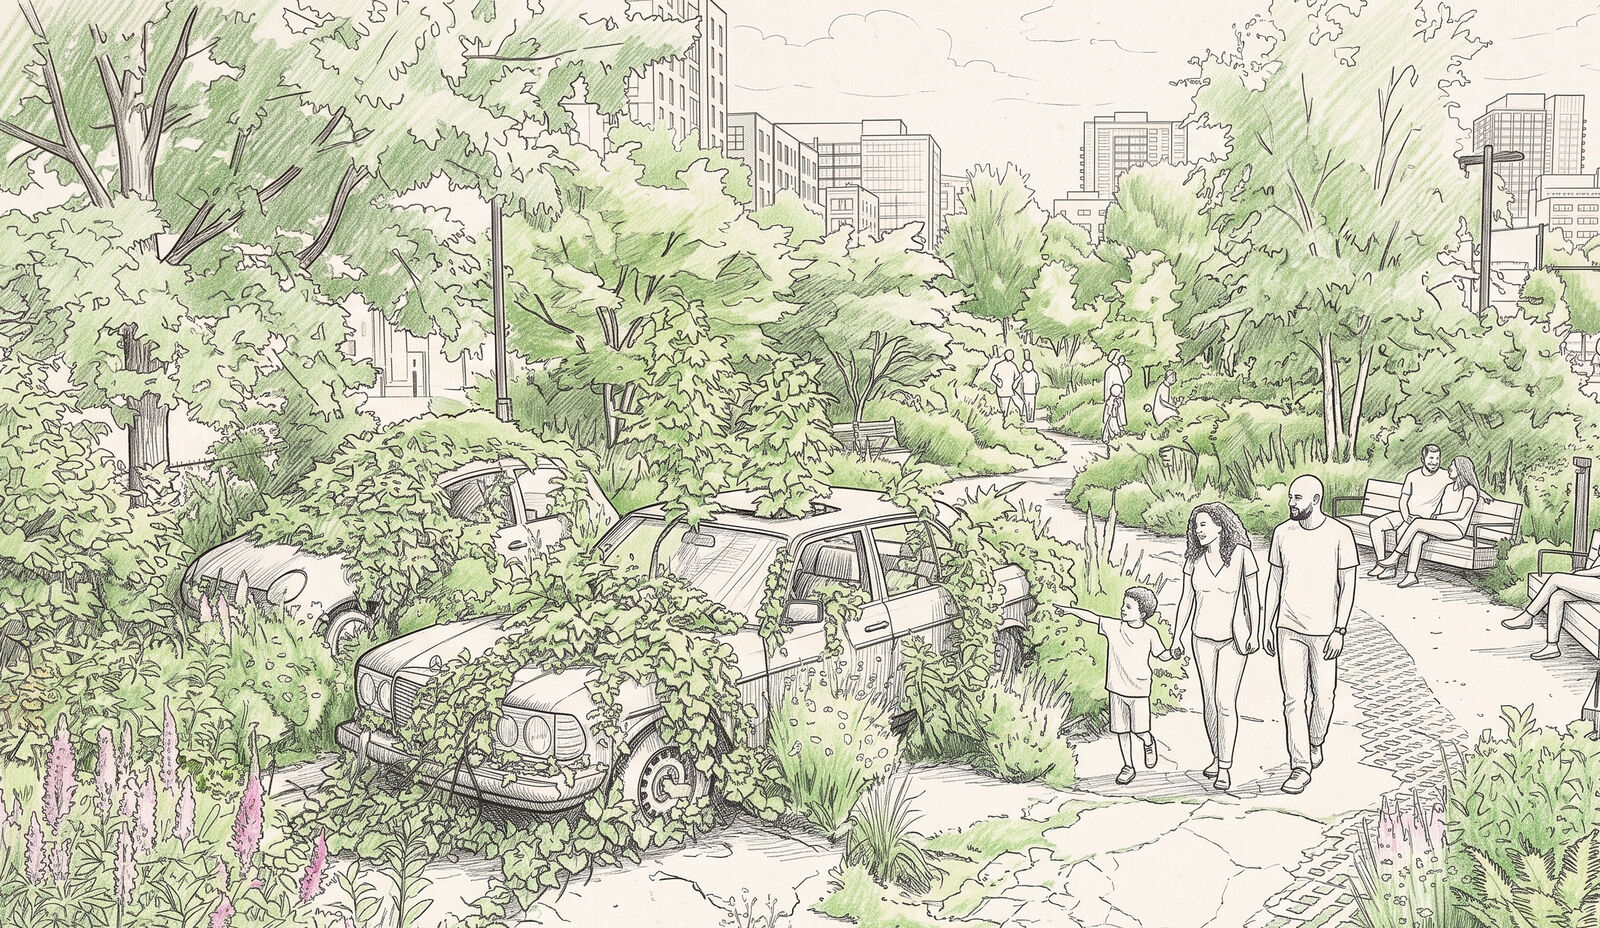
What if we got rid of cars?
It's getting hot in here and not in the good way.
During the 2026 June heatwave, more than 16,000 people in the EU have died because of heat stress. In cities, the situation is particularly dire. Any city is several degrees hotter than the surrounding countryside, an effect known as the urban heat island. Asphalt traps heat from the sun and keeps on releasing it deep into the night, giving no relief.
At the end of this heatwave, I spent a night in my hometown Bratislava to visit my grandmother. She lives on the fifth floor of an apartment building in Petržalka, the concrete jungle I grew up in. It was 'only' 34 degrees that day, but the heat was oppressive. In the evening even with all windows open, the heat would not leave the flat. I did not sleep that night.
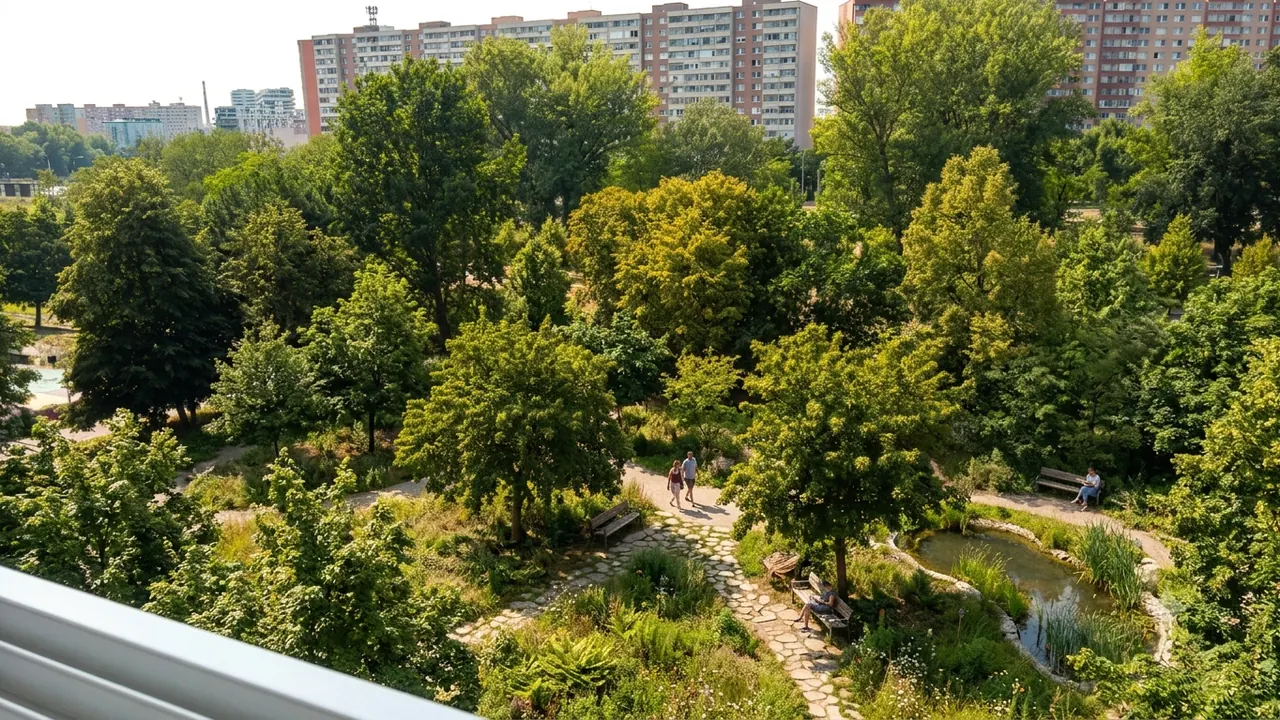
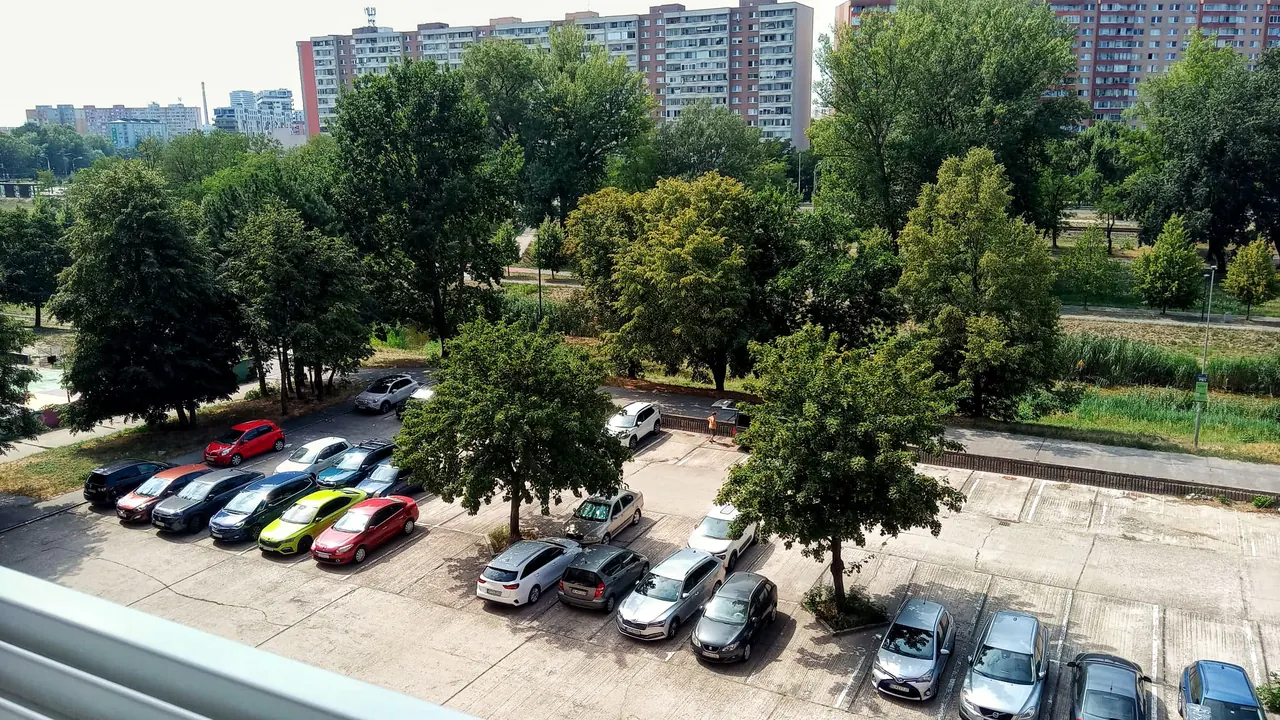
My grandma, © All rights reserved, reimagined by Gemini Nano Banana 2
While air conditioning (compared to the rest of the world still relatively uncommon in Europe) might provide momentary relief, it seems more like treating the symptoms rather than grabbing the problem by the roots. The real issue is how we design our cities, the materials we build with, and how we choose to allocate urban space.
In this essay, I explore what might happen if we replaced car infrastructure with trees.
Trees are cool
Any surface can bounce energy back to the sky, store it, heat the air with it, or spend it evaporating water. Asphalt cannot evaporate water, so it heats the air and absorbs a lot of the energy and releases the heat later. That is how an urban heat island emerges.
Asphalt's own surface can swing between roughly 40°C and 60°C on a sunny day, and it keeps releasing that stored heat into the air well after sunset. This is what makes cities suffocating in a heatwave.
Trees, on the other hand, cool the city down. Their shade prevents asphalt from absorbing the heat in the first place, and they use the energy they absorb to evaporate water in a process called evapotranspiration. It is what it sounds like: trees sweating! Just evaporating water like this can roughly halve the urban heat island effect.
850 W/m² of midday summer sunshine, with clear skies. Park at 50% canopy, well watered — a water-stressed tree stops sweating.
Asphalt
Well watered park
It's not crazy
Raising tree coverage could prevent deaths. Yet Europe is short of the green that does the cooling. This year scientists looked at 862 European cities to see how many adhere to the 3-30-300 rule: 3 trees visible from every home, 30% neighborhood canopy cover, and a park within 300 meters. They found that 15% of the population live in areas that meet all three criteria, while even more (21%) live in areas that meet none of them.
While ground in cities is scarce and valuable, there is one type of infrastructure we do allocate a lot of space to: cars. So what if we removed some of that car infrastructure?
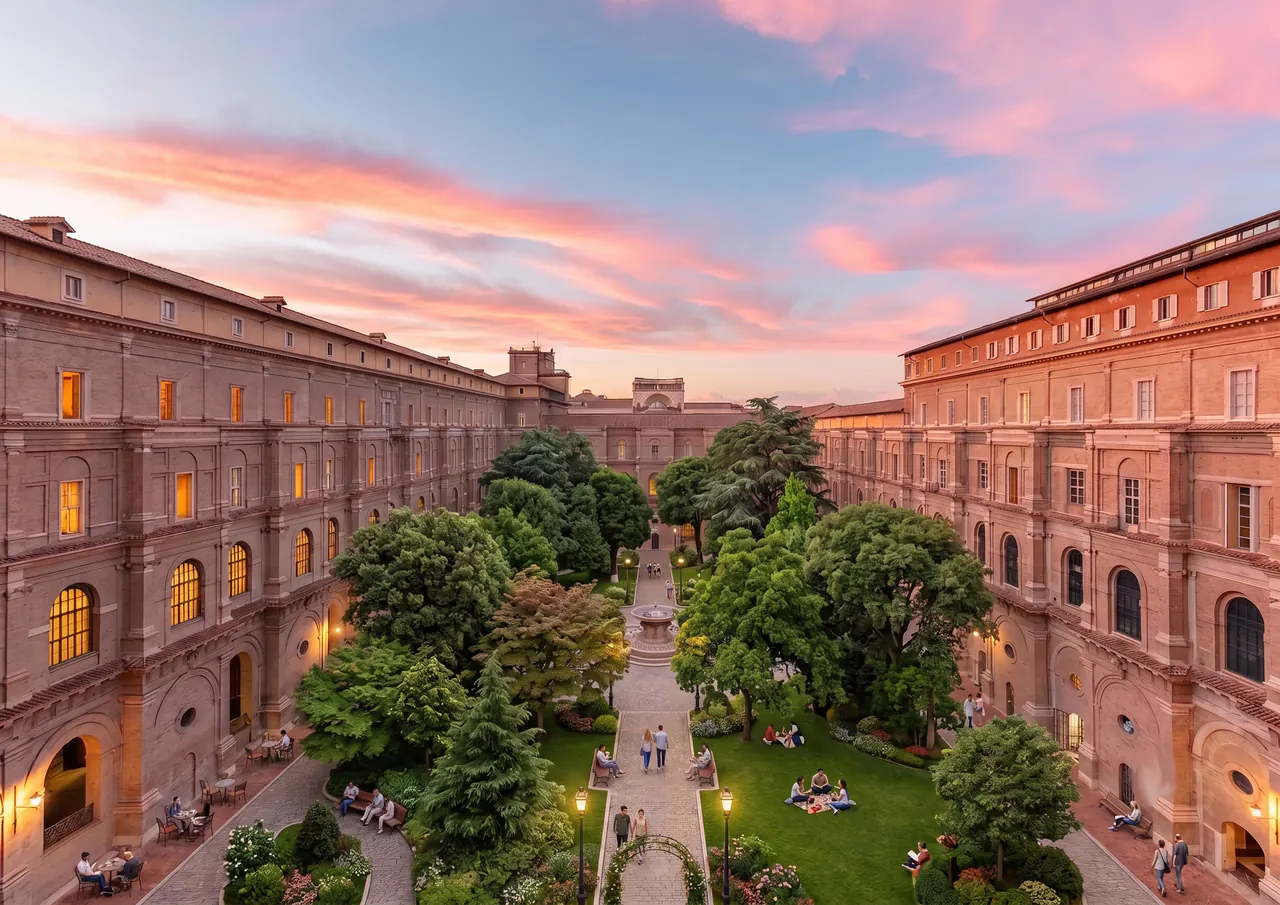
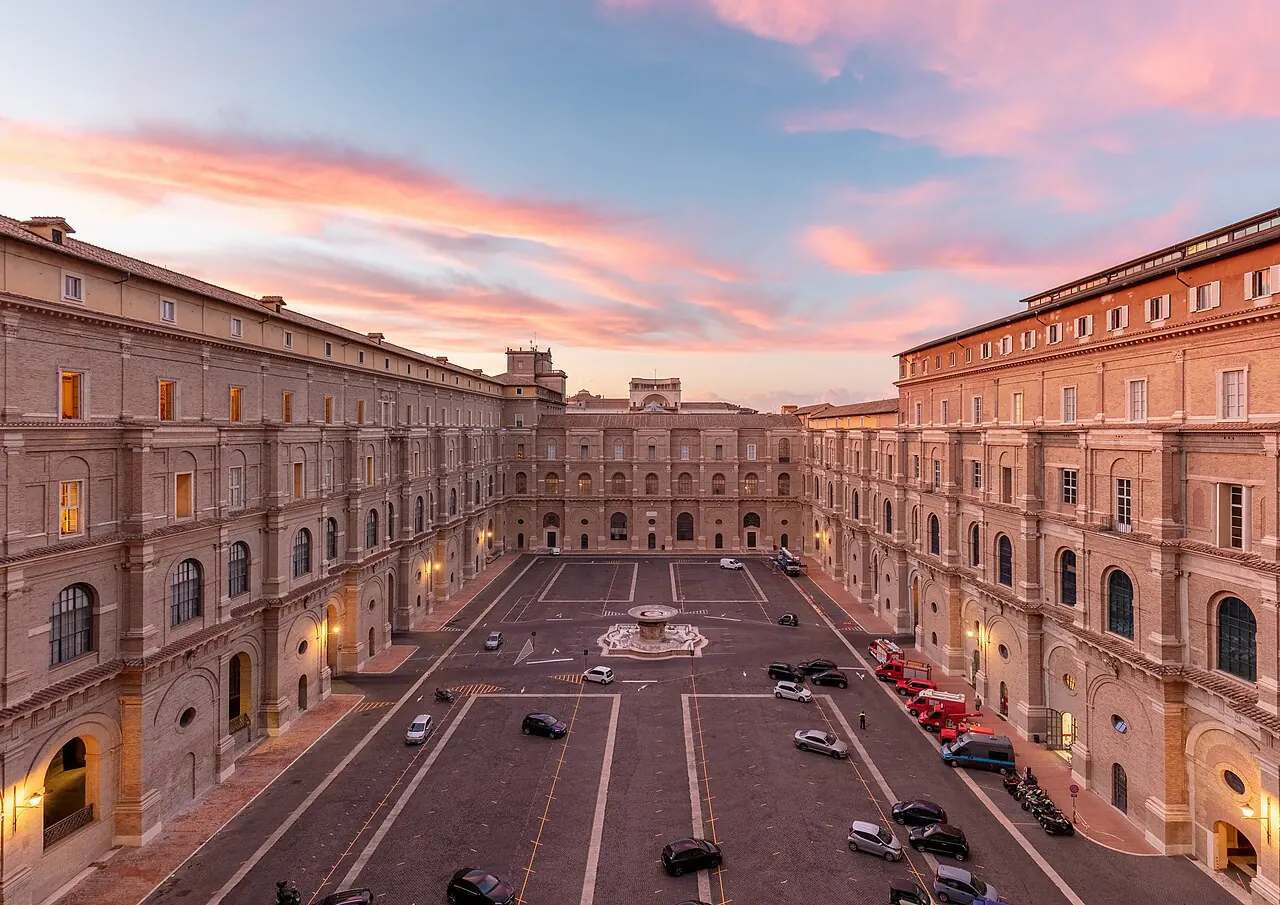
Diego Delso, delso.photo, License CC BY-SA, reimagined by Gemini Nano Banana 2
Turns out, good things happen. Pontevedra, in western Spain, banned most cars from its center in 1999. Traffic fell 53%, air pollution 67%, and the last traffic death was 15 years ago. Oslo cleared cars from its downtown core and turned the parking into benches, bike lanes and pocket parks. Paris set to remove 70,000 on-street parking spots and 24,000 were gone by early 2026. Barcelona's superblock plan aims to reclaim around 60%–70% of the street space currently given over to cars, converting interior streets into space for pedestrians, bicycles and trees.
In fact, cities they work better without cars. Time and time again when a city has closed off streets or removed parking spots, instead of increased congestion, the cars simply vanish. And trees, they are good for us. Being around trees has been linked to a range of health benefits, including lower blood pressure, less stress, a slower heart rate and lower rates of diabetes. It's an act of wellness and the Japanese have the word for it: 森林浴 (森林 = forest, 浴 = bath).
So what would happen if we sacrificed cars to trees?
Parks vs parking
For this little experiment, I have cut every city into 500 m squares. 500 meters is a five to ten minute walk, depends on how fast you go. In each square I measured how much of it is car infrastructure (road and parking) and how much is urban green, spaces you can enter and use for relief from heat: parks, gardens, cemeteries, forests, woods and nature reserves, private and public of at least 0.5 ha (see also the methodology below).
For example: Prague's urban core holds 1,052 of these squares, and its median resident's square is 14% green and 11% car. 8% of its residents live in a square like C, which holds none.
To find a typical value for each city, I used the population-weighted median. Instead of treating every square equally, I gave more weight to places where more people live. I sorted all squares by the amount of green space or car infrastructure and found the point where half of the city's population lives in squares with less, and half in squares with more. This gives a better picture of what the typical resident experiences. A large forest on the edge of the city counts less than a small park that thousands of people can walk to.
Ranked by green, largest first. Showing the cities as measured.
- 1 Helsinki Green 15.1% of the median square's land, car infrastructure 11.8%. No green: 6% of residents.
- 2 Prague Green 14% of the median square's land, car infrastructure 11%. No green: 8% of residents.
- 3 Stockholm Green 12.6% of the median square's land, car infrastructure 10.8%. No green: 6% of residents.
- 4 Oslo Green 8.8% of the median square's land, car infrastructure 11.3%. No green: 13% of residents.
- 5 Luxembourg Green 8.3% of the median square's land, car infrastructure 10.8%. No green: 14% of residents.
- 6 Bern Green 6.2% of the median square's land, car infrastructure 9.2%. No green: 21% of residents.
- 7 Madrid Green 5.5% of the median square's land, car infrastructure 12.5%. No green: 25% of residents.
- 8 London Green 4.6% of the median square's land, car infrastructure 11%. No green: 26% of residents.
- 9 Lisbon Green 4.3% of the median square's land, car infrastructure 13.3%. No green: 29% of residents.
- 10 Vilnius Green 4.3% of the median square's land, car infrastructure 12.3%. No green: 33% of residents.
- 11 Sarajevo Green 4.2% of the median square's land, car infrastructure 11.2%. No green: 28% of residents.
- 12 Berlin Green 3.8% of the median square's land, car infrastructure 11%. No green: 27% of residents.
- 13 Rome Green 3.8% of the median square's land, car infrastructure 10.8%. No green: 30% of residents.
- 14 Vienna Green 3.8% of the median square's land, car infrastructure 9.2%. No green: 27% of residents.
- 15 Amsterdam Green 3.3% of the median square's land, car infrastructure 10.4%. No green: 30% of residents.
- 16 Bratislava Green 3.2% of the median square's land, car infrastructure 13.5%. No green: 28% of residents.
- 17 Copenhagen Green 3.2% of the median square's land, car infrastructure 13.2%. No green: 30% of residents.
- 18 Zagreb Green 3.2% of the median square's land, car infrastructure 12.8%. No green: 30% of residents.
- 19 Tallinn Green 3.2% of the median square's land, car infrastructure 11.8%. No green: 37% of residents.
- 20 Chisinau Green 3% of the median square's land, car infrastructure 9.5%. No green: 37% of residents.
- 21 Brussels Green 3% of the median square's land, car infrastructure 9.5%. No green: 29% of residents.
- 22 Belgrade Green 2.8% of the median square's land, car infrastructure 11%. No green: 38% of residents.
- 23 Kyiv Green 2.8% of the median square's land, car infrastructure 11%. No green: 30% of residents.
- 24 Warsaw Green 2.5% of the median square's land, car infrastructure 13%. No green: 36% of residents.
- 25 Sofia Green 2.3% of the median square's land, car infrastructure 12.8%. No green: 39% of residents.
- 26 Dublin Green 2.3% of the median square's land, car infrastructure 11.8%. No green: 35% of residents.
- 27 Budapest Green 2.2% of the median square's land, car infrastructure 10.2%. No green: 39% of residents.
- 28 Paris Green 2% of the median square's land, car infrastructure 12.2%. No green: 36% of residents.
- 29 Athens Green 1.2% of the median square's land, car infrastructure 13.8%. No green: 43% of residents. Parking is under-mapped here; the car figure is a floor.
- 30 Ljubljana Green 0.5% of the median square's land, car infrastructure 13.5%. No green: 47% of residents.
- 31 Skopje Green 0.2% of the median square's land, car infrastructure 10.8%. No green: 49% of residents.
- 32 Reykjavik Green 0% of the median square's land, car infrastructure 15.8%. No green: 52% of residents.
- 33 Nicosia Green 0% of the median square's land, car infrastructure 14.8%. No green: 63% of residents.
- 34 Bucharest Green 0% of the median square's land, car infrastructure 13%. No green: 60% of residents.
- 35 Pristina Green 0% of the median square's land, car infrastructure 12.8%. No green: 63% of residents.
- 36 Valletta Green 0% of the median square's land, car infrastructure 12.7%. No green: 81% of residents. Parking is under-mapped here; the car figure is a floor.
- 37 Podgorica Green 0% of the median square's land, car infrastructure 12.2%. No green: 57% of residents.
- 38 Tirana Green 0% of the median square's land, car infrastructure 11.2%. No green: 67% of residents.
- 39 Riga Green 0% of the median square's land, car infrastructure 10.7%. No green: 55% of residents.
Source: OpenStreetMap. † = parking under-mapped in OpenStreetMap.
-
Turns out that the availability of green spaces available a short walk from where most people in a city live is the best in Helsinki, Prague and Stockholm. Here also the amount of people living close to no green is quite low.
-
In eight cities more than half of the population lives without any green close by.
-
This while the car infrastructure gets a steady median value of 9 to 16% in each of the cities.
Let's experiment 🧪
Now, what if we replaced all surface parking with green space? And what if we went a step further? Let's also convert 60% of residential streets that aren't major traffic arteries, similar to what Barcelona is doing. The picture changes a lot.
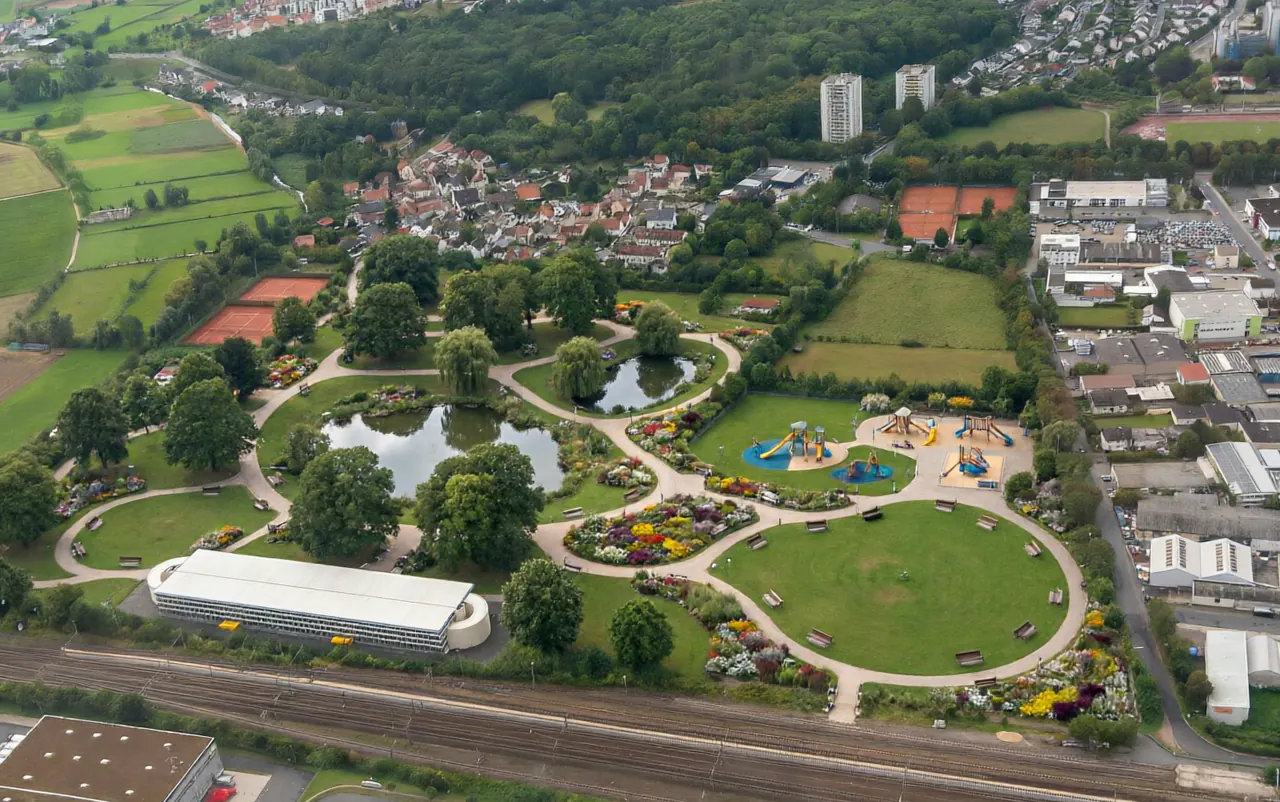
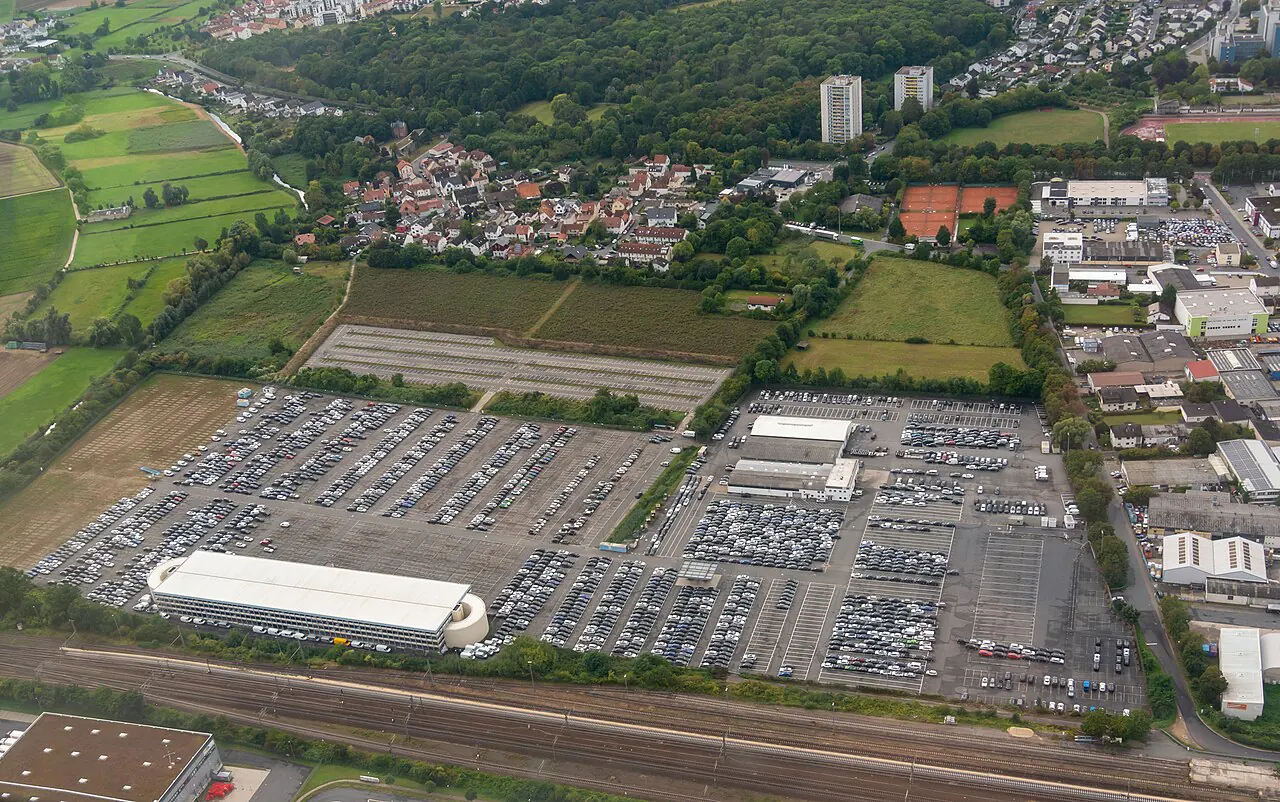
Matti Blume, CC BY-SA, reimagined by Qwen3.8
Ranked by green, largest first. Showing the converted scenario.
- 1 Helsinki Green 22.1% of the median square's land, car infrastructure 5.3%. No green: 0% of residents.
- 2 Prague Green 20.2% of the median square's land, car infrastructure 4.5%. No green: 0% of residents.
- 3 Stockholm Green 19% of the median square's land, car infrastructure 4.9%. No green: 0% of residents.
- 4 Oslo Green 15% of the median square's land, car infrastructure 5.7%. No green: 0% of residents.
- 5 Luxembourg Green 14.4% of the median square's land, car infrastructure 5.2%. No green: 0% of residents.
- 6 Bratislava Green 13.2% of the median square's land, car infrastructure 5.1%. No green: 0% of residents.
- 7 Tallinn Green 13% of the median square's land, car infrastructure 4.9%. No green: 0% of residents.
- 8 Vilnius Green 12.2% of the median square's land, car infrastructure 5.9%. No green: 0% of residents.
- 9 Madrid Green 11.7% of the median square's land, car infrastructure 7%. No green: 0% of residents.
- 10 Reykjavik Green 11.4% of the median square's land, car infrastructure 5.8%. No green: 0% of residents.
- 11 Copenhagen Green 11.3% of the median square's land, car infrastructure 6.2%. No green: 0% of residents.
- 12 Bern Green 11.3% of the median square's land, car infrastructure 4.7%. No green: 0% of residents.
- 13 Lisbon Green 11.2% of the median square's land, car infrastructure 6.8%. No green: 0% of residents.
- 14 Zagreb Green 11.2% of the median square's land, car infrastructure 5.8%. No green: 0% of residents.
- 15 Ljubljana Green 11.2% of the median square's land, car infrastructure 5.5%. No green: 0% of residents.
- 16 Warsaw Green 11.2% of the median square's land, car infrastructure 5.5%. No green: 0% of residents.
- 17 Sarajevo Green 11.2% of the median square's land, car infrastructure 5.2%. No green: 0% of residents.
- 18 London Green 11% of the median square's land, car infrastructure 5.3%. No green: 0% of residents.
- 19 Berlin Green 10.8% of the median square's land, car infrastructure 4.8%. No green: 0% of residents.
- 20 Rome Green 10% of the median square's land, car infrastructure 5.3%. No green: 0% of residents.
- 21 Sofia Green 9.4% of the median square's land, car infrastructure 6%. No green: 0% of residents.
- 22 Nicosia Green 9.2% of the median square's land, car infrastructure 6.7%. No green: 0% of residents.
- 23 Kyiv Green 9.2% of the median square's land, car infrastructure 5.3%. No green: 0% of residents.
- 24 Dublin Green 9.1% of the median square's land, car infrastructure 5.7%. No green: 0% of residents.
- 25 Amsterdam Green 9.1% of the median square's land, car infrastructure 5.1%. No green: 0% of residents.
- 26 Belgrade Green 8.6% of the median square's land, car infrastructure 5.5%. No green: 0% of residents.
- 27 Vienna Green 8.4% of the median square's land, car infrastructure 4.8%. No green: 0% of residents.
- 28 Riga Green 8% of the median square's land, car infrastructure 4.6%. No green: 0% of residents.
- 29 Brussels Green 7.9% of the median square's land, car infrastructure 4.9%. No green: 0% of residents.
- 30 Athens Green 7.8% of the median square's land, car infrastructure 8.1%. No green: 0% of residents. Parking is under-mapped here; the car figure is a floor.
- 31 Valletta Green 7.6% of the median square's land, car infrastructure 5.1%. No green: 0% of residents. Parking is under-mapped here; the car figure is a floor.
- 32 Budapest Green 7.6% of the median square's land, car infrastructure 4.7%. No green: 0% of residents.
- 33 Bucharest Green 7.4% of the median square's land, car infrastructure 6.5%. No green: 0% of residents.
- 34 Pristina Green 7.3% of the median square's land, car infrastructure 6.1%. No green: 0% of residents.
- 35 Podgorica Green 7.3% of the median square's land, car infrastructure 5.4%. No green: 0% of residents.
- 36 Chisinau Green 7.3% of the median square's land, car infrastructure 5.1%. No green: 0% of residents.
- 37 Skopje Green 7% of the median square's land, car infrastructure 5%. No green: 1% of residents.
- 38 Paris Green 6.8% of the median square's land, car infrastructure 7.5%. No green: 0% of residents.
- 39 Tirana Green 5.8% of the median square's land, car infrastructure 6.2%. No green: 0% of residents.
Source: OpenStreetMap. † = parking under-mapped in OpenStreetMap.
-
The median share of green in a city rises from 0-15% to 6-22% and almost no one lives far from trees.
-
The cars are still present, but now occupy just 5-8% of the median surface.
Before there are plans, there are ideas. This is an exercise in imagination. I am reluctant to say 'just' because imagining something is a first step to change. As more and more of us live in cities and as the climate keeps getting hotter, we do need to imagine some serious change.
Many examples of cities that have replaced the cars with trees show us that we can do something about the suffering that heatwaves bring to our cities. First we need to imagine what a city should look like, and especially who and what it should serve. Trees are political.
While embracing the air conditioning can be a part of it all, we should first ask how we build our cities and for whom: comfortable for the few, or pleasant to live in for everyone?
Czechia · urban core, home to 88% of the city’s residents
- Median green
- 14% of land
- Median car
- 11% of land
- No green
- 8% of people
How this was measured
Green and car infrastructure
Urban green = OpenStreetMap polygons of parks, gardens, recreation grounds, commons, village greens, dog parks and cemeteries, nature reserves, forest and woodlands. Dissolved so overlaps count once, open water subtracted, and nothing under 0.5 ha (the size at which the WHO's starts counting a green space at all). The categories verge grass, meadow, grassland, heath, scrub and gated allotments are left out of the calculation.
Car infrastructure = every carriageway plus every surface parking area,
dissolved together so overlaps count once. Roads are buffered from OSM
centrelines: the tagged width where present, otherwise
lanes × 3.25 m, otherwise defaults
per road class. Kerb-to-kerb means sidewalks and separated cycle tracks
are excluded by construction; painted bike and bus lanes are included.
Multi-storey and underground parking is excluded: this measures ground.
Each 500 m square that is more water than land, or that hangs off the core's edge, is dropped. Every square left gets its own green share and car share of its land, and its resident count from GHS-POP; both medians are population-weighted, squares sorted by value until cumulative population crosses half. "No green" is the share of a core's residents standing in a square with no green in it at all. The converted state re-runs all three with every surface parking lot and 60% of the interior street area moved from car to green.
Everything is measured inside each capital's 'urban centre', according to the EU/UN Degree of Urbanisation definition (GHS-SMOD): the contiguous dense settlement, intersected with the municipal boundary, and divided by the residents of that same area. On the top of the map it states what share of the municipal population lives in the core being measured; in compact capitals it is nearly everyone, in sprawling ones (Vilnius, Belgrade) a quarter to a third live outside it.
Energy transformation of trees and asphalt
Figures are illustrative, not measurements, calculated with Claude and verified over multiple iterations. Incoming shortwave radiation of 850 W/m² represents clear-sky midday conditions in mid-latitude summer. Albedo values (asphalt 0.12, park 0.18, a half grass half canopy mix) and surface emissivities follow standard published ranges (Oke 1987; Oke, Mills, Christen & Voogt 2017). Longwave losses are calculated from assumed surface temperatures of approximately 53 °C for asphalt and 30 °C for the park canopy. How much of what is left goes into the ground follows storage partition coefficients of 0.60 for asphalt and 0.10 for the park, inside the ranges Hsieh, Chiu, Huang & Visessri (2023) compiled from published surface energy balances: 0.21–0.71 for urban surfaces, 0.07–0.31 for vegetation. The partitioning of available energy is consistent with Anandakumar (1999) for dry asphalt and Spronken-Smith, Oke & Lowry (2000) for an irrigated urban park. Neither study reports the values shown here. Actual fluxes vary with latitude, season, sky condition, canopy structure, irrigation regime and surrounding urban form.
If you find a substantial issues with this methodology please get in touch!
Geometry © OpenStreetMap contributors, ODbL (incl. ocean polygons via
osmdata.openstreetmap.de).
Population, land & urban centres: EU JRC GHSL
(GHS-POP R2023A, GHS-LAND R2022A, GHS-SMOD R2023A).
Urban heat island: Copernicus C3S / VITO UrbClim intensity model via the
EEA, CC BY 4.0.
Paris road widths calibrated against Ville de Paris open data (Plan de
Voirie).
Analysis and code by Ada Homolova & Claude Opus 5